![]()
Radar spectrum
The integrated velocity radar sensor has an opening angle of 12°. Thus, the reflected radar signal of an area is measured. The size of this area depends on the inclination angle and the distance between the sensor and the reflecting water surface.
The velocities appearing in the measured area have a specific distribution depending on the water flow conditions. The velocity distribution is determined with a digital signal processor via spectral analysis, and the dominant velocity in the measurement area is calculated.
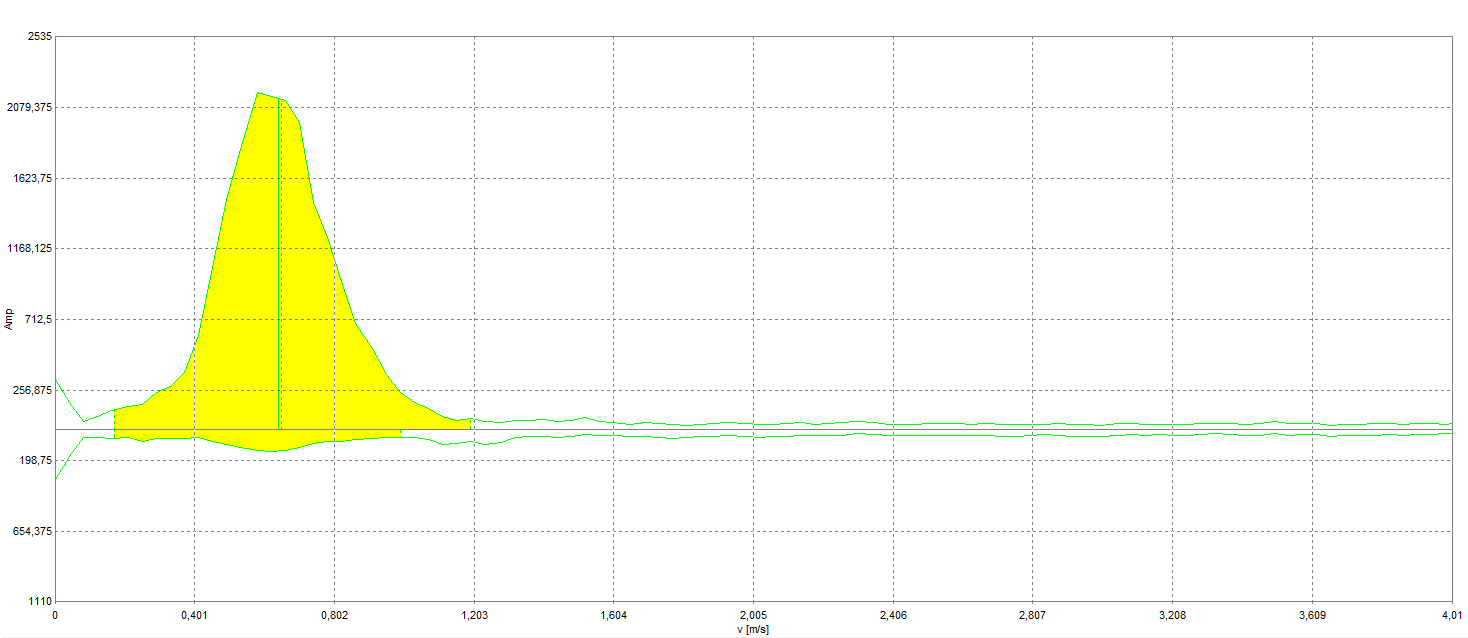
As illustrated in Figure 4 the radar spectrum is recorded for water flows up- and downstream. In the lower part of Figure 4 the velocity spectrum of water flowing away from the radar sensor is displayed, in the upper part the spectrum of water flowing towards the sensor. The yellow area is the part of the spectrum used for analysis and the vertical green line indicates the resulting velocity.
By interpreting the radar spectra, velocity measurements can be analyzed in detail. A spectrum can have a narrow or broad peak, one or more maxima or it can identify only one velocity direction. Awareness of this can result in a modification of the settings for the velocity measurement.
For detailed information on how to proceed if more than one peak is visible in the radar spectrum please refer to .